Like many of my fellow Los Angelinos, I am a fan of futbol soccer every 4 years when my world (both real and Facebook) is drowned in chants of “I believe that we will win! I believe that we will win!” So you can imagine my surprise today when the TV screen showed that the USA is advancing despite our loss to Germany. I didn’t get it and had to understand why, so I turned to soccer metrics.
It’s not the first time I’ve related business metrics to fitness/sports metrics – drawing comparisons on how the financial metrics in a business are like the scoreboards of a basketball or real American football games. It turns out, soccer scoring system is a ton more complex and interesting than the sports that us Americans are more familiar with. Here’s a quick break down of what I learned today and why the USA advanced despite losing to Germany and “tying” with Portugal.
How to read soccer standings
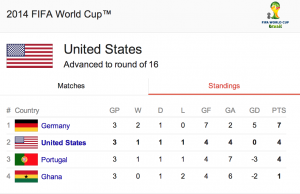
A quick google search for “USA FIFA standing” will bring up a dashboard of soccer metrics you see here. At first, I had thought the team with the most WINs move on – like basketball or hockey. So it made sense that Germany is moving on, but why is the USA moving on while Portugal is left behind? They both won 1 game, tied 1, and lost 1. (I won’t even go into ties in this post.) I had to find out what the other metrics are and how they played a role.
The abbreviations of soccer standings
GP = Games Played
W = Win
D = Draw
L = Loss
so far so good even with the “daw”… here’s where things get interesting
GF = “goals for”
GA = “goals against”
GD = “goal difference” which is GF – GA
PTS = “points” which I had thought (and it looked like at first glance) was the total points scored between all 3 games, but that didn’t make sense for Ghana. Further understanding showed this was a tally for the W/D/L combination. The team gets 3 pts for a win, 1 pts for a draw, and 0 pts for a loss. The math worked out beautifully.
That is a TON of numbers for a sports game! and this is where my inner nerd giggled a little.
The hierarchy of metrics.
I am still not sure if the WIN count is factored in at all or does it not matter since it gets converted into PTS anyway. Can a team have more WINs but less PTS than another team? In that case, does the WIN count trump the PTS?
Either way, for the sake of team USA, it doesn’t matter. What mattered to us was that even though it looks like we tied with Portugal in terms of W/D/L count and PTS. the next metric on the hierarchy that comes into play was the Goal Difference. In which case we have 0 (we scored as many times as we were scored on) while Portugal’s GD was -3. Fascinating.
So now that I learned why team USA is moving on – I am left wondering how each soccer team (futbol club) views and strategizes each game using these metrics like a business would. I wouldn’t be surprised if there’s someone on the team dedicated to crunching the numbers in figuring out what the target outcome of each match should be throughout the playoff. Factoring in the strength/weaknesses of the opponents, next match up, and the current standing of the team. It’s not hard to imagine that the team with a sound insight to all this have an additional advantage to simply having the best team in the world.
What do you think? Did you draw the same conclusion that soccer teams use these metrics to influence their play strategy? If so, do you have a set of business metrics that drive your business strategy? What does it look like and how is it similar/different?